Explosion characteristics of methane at elevated initial temperatures
VÝBUCHOVÉ CHARAKTERISTIKY METANU ZA ZVÝŠENÝCH POČÁTEČNÍCH teplot
Jan Skřínský1,2, Ján Vereš1, Jana Trávníčková1, Andrea Dalecká1
1Energy Research Centre, VSB-Technical University of Ostrava, corresponding author: jan.skrinsky@vsb.cz
2Department of Major Accidents Prevention, Occupational Safety Research Institute
Abstrakt
V příspěvku prezentujeme teoretickou studii maximálního výbuchového tlaku a adiabatické teploty plamene. Maximální výbuchové tlaky, počítané za předpokladu chemické rovnováhy na čele výbuchové vlny jsou porovnány s hodnotami experimentálně změřených maximálních výbuchových tlaků. Srovnání experimentálně změřených tlaků s vypočítanými adiabatickými tlaky ilustrují stupeň adiabacity výbuchu. Vypočítané hodnoty maximálního výbuchového tlaku pro standardní podmínky jsou porovnány s experimentálními hodnotami a s hodnotami vypočtenými. Výsledky představují pokračování snahy různých vědeckých skupin v oblasti problému porozumění výsledkům získaných experimentálně pro predikci následků scénářů výbuchů plynů v průmyslu.
Klíčová slova: maximální výbuchový tlak, adiabatická teplota při konstantním objemu, metan
Abstract
A theoretical study on maximum explosion pressure and constant volume adiabatic flame temperature is presented. The maximum explosion pressures, computed by assuming chemical equilibrium within the explosion front are examined in comparison with the measured explosion pressures. Comparisons of the experimentally measured pressures with the calculated adiabatic pressures indicate the degree of adiabacity of the explosion. The calculated peak explosion pressures of methane-air mixtures for ambient conditions are examined in comparison with the experimental values and with the calculated adiabatic explosion pressures. The results represents a continuation of numerous efforts by various research groups, where the key underlying problem has been the understanding of results obtained in laboratory tests for predicting the consequences of gas explosion scenarios in industry.
Keywords: maximum explosion pressure, constant volume adiabatic temperature, methane
1. Introduction
Methane-air is the most widely used mixture to demonstrate the validity of any new theoretical or experimental approach to determine its combustion or explosion parameters due to availability of many theoretical and experimental results using various techniques (Eckhoff, 2005). The characteristic parameters of methane in a closed vessel explosion, so called explosion characteristics, discussed in this contribution are the maximum explosion pressure and the adiabatic explosion temperature. The maximum explosion pressure is the highest explosion pressure over the flammable range in a closed volume at a given fuel concentration. The constant volume adiabatic explosion temperature is the temperature of any monophase or multiphase system formed by the oxidation of a fuel-oxidant mixture or the decomposition of an endothermic compound, in the absence of energy loss (Movileanu et al., 2011). Both, the explosion pressure and the explosion temperature are important for design of safety devices (e.g. relief systems, vents), able to ensure active protection of pressure vessels where flammable mixtures are formed. Beyond safety devices, the values of these parameters are useful for emergency planning especially for developing scenarios where emergency relief or external heat transfer may be inadequate. At the same time, the maximum explosion pressure and temperature that the explosion reaction can generate is one good measure of the magnitude of the hazard associated with the reaction (CCPS, 1995). Primarily, the maximum explosion pressures and explosion temperatures are determined experimentally. These experiments could be, however, expensive and time consuming, especially at elevated conditions of temperature and pressure, at which many industrial processes occur. Therefore, methods are being sought with which approximate values of explosion pressure and temperature can be calculated in reasonable time. The present contribution presents explosion pressures and constant volume adiabatic explosion temperatures of stoichiometric methane - air mixtures calculated for various initial temperatures.
2. Previous studies
Results of explosion experiments depend on many different parameters of the investigated process, such as the energy and type of ignition source, size and shape of explosion chamber, initial temperature, initial pressure and composition of the flammable mixture. To ensure the compatibility of data we selected the results for experiments that are in agreement with EN 13673-1 with the only exception that is volume of the testing vessel. The values of measured maximum explosion pressures, collected from literature (Razus et al., 2006; EN 13673-1; Cashdollar, 2000), are given in Table 1.
| Pexp | CH4 | Vessel volume | Reference |
|---|---|---|---|
| (bar(a))x | (vol.%) | (m3) | |
| 7.00 | 10.0 | 4.2 x 10⁻³ | Razus et al., 2006 |
| 8.10 | 9.5 | 5.0 x 10⁻³ | Razus et al., 2006 |
| 8.70 | 9.5 | 5.0 x 10⁻³ | Razus et al., 2006 |
| 8.30±0.3 | 10.5± 0,5 | 20.0 x 10⁻³ | EN 13673-1 |
| 8.10 | 9.5 | 20.0 x 10⁻³ | Razus et al., 2006 |
| 8.50 | 10.9 | 20.0 x 10⁻³ | Razus et al., 2006 |
| 8.30 | 10.0 | 20.0 x 10⁻³ | Cashdollar, 2000 |
| 8.20 | 10.2–10.5 | 20.0 x 10⁻³ | Razus et al., 2006 |
| 8.00 | 9.5 | 20.0 x 10⁻³ | Razus et al., 2006 |
| 8.50±0.1 | 10.0 | 120.0 x 10⁻³ | Cashdollar, 2000 |
| 7.60±0.1 | 10.0 | 25.0 | Cashdollar, 2000 |
| 7.70 | 9.5 | 204.0 | Razus et al., 2006 |
xbar(a)
Table 1: Measured explosion pressure, pexp, of methane–air mixtures, at ambient initial pressure, p0 = 1 bar(a), and temperature, T0 = 298 K
(Razus et al., 2006) reports measurement of explosion pressures of methane-air mixtures, at various initial concentrations close to stoichiometric (9.5-10.5 vol.%), in closed vessels of different volumes. The results have shown a similar behavior of investigated system. The maximum explosion pressures are (8.3±0.3) bar(a) for measurements made in the standard 20.0x10⁻³ m3 spherical vessel. Higher deviations from these values are observed, however, when using smaller or larger size vessels, where radiative and convective heat losses to the walls could be neglected. Especially for larger volumes, close to the volumes used by industry, with maximum explosion pressures (7.60-7.70 bar(a)) were obtained in a 25 and 204 m3 spherical vessels (Razus et al., 2006, Cashdollar, 2000). (Cashdollar et al., 2000) reports different values of maximum explosion pressures for methane-air mixtures, depending on the volume of the explosion vessel: 8.30 bar(a) in a 20.0x10⁻³ m3 explosion vessel and 8.5 bar(a) in a 120.0x10⁻³ m3 explosion vessel. The reported results from 5.0 x 10⁻³ are identical to those results obtained in the 20.0x10⁻³ m3 and 120.0x10⁻³ m3 despite the great difference in volume. There are not reported experimental studies for 1 m3.
Apart from experiments, there are just a few data obtained in a series of calculations performed for methane - air close to stoichiometric concentration (9.5-10.0 vol.%) at ambient conditions. The values of calculated adiabatic flame temperatures and explosion pressures, collected from literature (Movileanu et al., 2011; Cashdollar et al., 2000; Eckhoff, 2005), are given in Table 2.
| CH4 | Tf | Pexp | Reference |
|---|---|---|---|
| (vol.%) | (K) | (bar(a)) | |
| 9.5 | 2579.2 | 8.80 | Movileanu et al., 2011 |
| 9.5 | 2585.6 | 8.68 | Movileanu et al., 2011 |
| 10.0 | - | 8.90 | Cashdollar et al., 2000 |
| 9.5 | 2591.0 | 8.60 | Eckhoff, 2005 |
Table 2: Calculated maximum explosion pressures, Pexp, and adiabatic flame temperatures, Tf, of methane-air mixtures (9.5 vol. %), at ambient initial pressure, p0 = 1 bar(a) and temperature, T0 = 298 K
The wide use of cylindrical vessels in laboratory-scale explosion studies enables the summary of data reported by other authors, for methane-air in various initial vessel volumes (Table 1). The experimental data could also be compared to those obtained from calculations summarized in Table 2. Both, the calculated and measured explosion pressures and temperatures are compared in Figure 1. There are no 1 m3 data available in the literature.
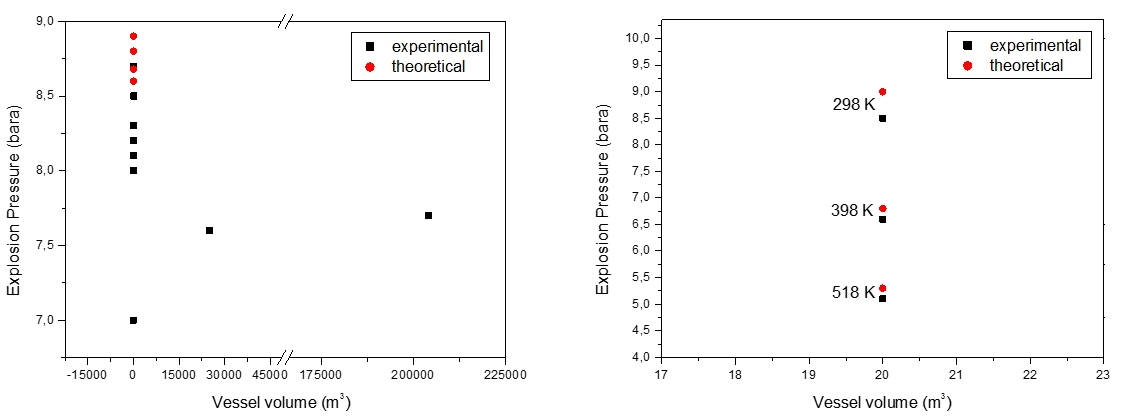
Figure 1: Previous studies on methane-air mixture at initial ambient (left) and elevated (right) temperatures
At elevated conditions, data on the explosion parameters of methane - air mixture (11 vol.%) and data on major post combustion products (CO, CO2, H2O) are limited. Up to now, accurate and reliable values are available in (Pekalski et al., 2005) and are summarized in Figure 1 and Table 3.
| Compound | Calculations | Experiments | ||||
|---|---|---|---|---|---|---|
| 21.5% | 21.1% | 19.5% | 21.5% | 21.1% | 19.5% | |
| CO | 15.6% | 15.4% | 14.3% | 0.36% | 0.88% | 12.48% |
| CO2 | 1.41% | 1.45% | 1.64% | 0.14% | 0.24% | 2.93% |
| H2O | 7.69% | 8.09% | 1.01% | 0.72% | 1.69% | 9.88% |
Table 3: Experimental and calculated post explosion gas composition of the main species for CH4 – O2 – N2 mixture, Pinit = 5 bar(a), Tinit = 240°C (Pekalski et al., 2005).
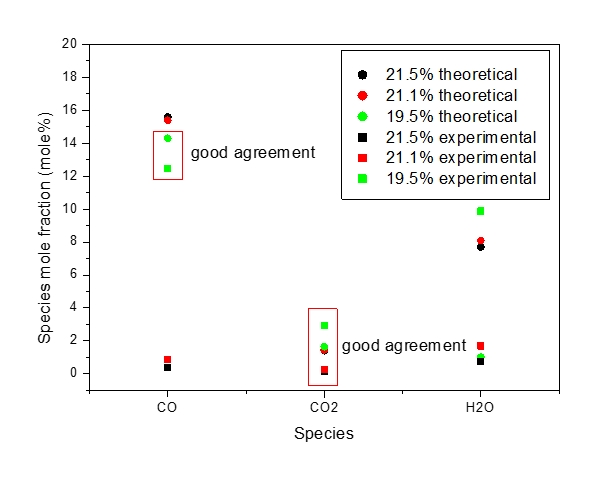
Figure 2: Species composition in post-explosion CH4 – O2 – N2 mixture (mole%) (Pekalski et al., 2005).
The aim of the previous studies was at summarizing the data for maximum explosion pressure, constant volume adiabatic temperature at ambient conditions and studying the combined effects of initial elevated temperature and fuel volume fractionon the explosion parameters and selected explosion post combustion products. This information is further used for the comparison with our calculated estimates.
3. Analysis
Present model based on the JAVA platform and is tested in NetBeans IDE 7.4. The model computes adiabatic flame temperatures and constant volume adiabatic explosion pressures of methane-air mixture at various initial temperatures, taking into account 26 species (H, H2, O, O2, HO2, H2O, H2O2, OH, CO, CO2, CHO, CH3, CH2O, HCN, NO, N2O, NO2, CH2CO, NH2, HNO, C2N2, NH3, N2, CH2OH, C2H4, C) and assuming the thermodynamic equilibrium reached in the flame front of the explosion.
Element balanced equation:
![]() (1)
(1)
where aj are moles of j-th element (atom); niare moles of i-th species; Ai,j number of j-th element in i-th species; l is the number of elements; j is the number of species.
The free energy (Helmholtz function) of the system F equation:
![]() (2)
(2)
where F is the free energy (Helmholtz function) of the system; ni are moles of i-th species; fi is free energy of i-th species.
![]() (3)
(3)
where fi is free energy of i-th species; λi are the Lagrangian multipliers for each element (j=1 to J); Ai,j number of j-th element in i-th species.
![]() (4)
(4)
where gi is the Gibbs free energy for single i-th species; ΔHfis the enthalpy of formation of the i-th species at standard conditions;
![]() (5)
(5)
where giis the Gibbs free energy for single i-th species; R is the universal gas constant; T is temperature; ni is the number of moles of every species; V is the volume.
![]() (6)
(6)
where aj are moles of j-th element (atom); niare moles of i-th species; Ai,j number of j-th element in i-th species; l is the number of elements; j is the number of species; gi is the Gibbs free energy for single i-th species; λi are the Lagrangian multipliers for each element (j=1 to J); R is the universal gas constant; T is temperature; ni is the number of moles of every species; V is the volume.
![]() (7)
(7)
where gi is the Gibbs free energy for single i-th species; Ai,j number of j-th element in i-th species; l is the number of elements; λi are the Lagrangian multipliers for each element (j=1 to J); R is the universal gas constant; T is temperature; ni is the number of moles of every species; V is the volume.
Known values of λi allow calculating the composition of the product xi. The required solution is when Helmholtz function reaches a minimum for all species from 1 to l. The chemical equilibrium is reached when the Gibbs free energy is minimized (first part from Equations 6-7) and if the mass balance of each element is conserved (second part of the Equations 6-7). Besides the energy balance also the mass balance must be conserved for a closed system, the number of atoms of the elements must be the same for the initial and end state. At constant volume conditions the Helmholtz free energy needs to be minimized (Equations 4-5). Knowing the Gibbs or the Helmholtz energy at given temperature and pressure the chemical equilibrium is calculated. The element potential approach in the thermochemical equilibrium calculations applied in subroutine has been used for explosion pressure calculations. The chemical equilibrium model assumes adiabatic conditions in a constant volume, and formation of equilibrium defined concentrations of post explosion compounds and their expansion due to the temperature rise caused by the liberated heat. The theory of thermodynamics is described in (Moore, 1979). The theory of chemical equilibrium analysis is described in (Reynolds, 1986).
4. Results and discussion
Computed adiabatic temperatures, Tf, and maximum explosion pressures, pmax , for methane-air mixtures (4.80 vol. %, 10.50 vol. %, 15.50 vol. %) at various initial temperatures, Tinit, and ambient initial pressure are given in Table 4-6.
| Methane concentration 4.80 vol. % | |||||||||
|---|---|---|---|---|---|---|---|---|---|
| Tinit (K) | 298 | 328 | 358 | 388 | 418 | 448 | 478 | 508 | 538 |
| pmax (bar(a)) | 5.91 | 5.43 | 5.03 | 4.70 | 4.41 | 4.16 | 3.94 | 3.75 | 3.58 |
| Tf (K) | 1761 | 1781 | 1802 | 1822 | 1843 | 1864 | 1884 | 1905 | 1926 |
Table 4: Computed explosion pressures and constant volume adiabatic flame temperatures, Tf, for methane-air mixtures, at T0 = 298 K and p0 = 1 bar(a)
| Methane concentration 10.50 vol. % | |||||||||
|---|---|---|---|---|---|---|---|---|---|
| Tinit (K) | 298 | 328 | 358 | 388 | 418 | 448 | 478 | 508 | 538 |
| pmax (bar) | 8.80 | 8.02 | 7.38 | 6.83 | 6.36 | 5.96 | 5.60 | 5.29 | 5.01 |
| Tf (K) | 2587 | 2593 | 2600 | 2608 | 2615 | 2622 | 2630 | 2637 | 2645 |
Table 5: Computed explosion pressures and constant volume adiabatic flame temperatures, Tf, for methane-air mixtures, at T0 = 298 K and p0 = 1 bar(a)
|
|
Methane concentration 15.50 vol. % | ||||||||
|---|---|---|---|---|---|---|---|---|---|
| Tinit (K) | 298 | 328 | 358 | 388 | 418 | 448 | 478 | 508 | 538 |
| pmax (bar(a)) | 8.08 | 7.41 | 6.84 | 6.37 | 5.96 | 5.61 | 5.30 | 5.03 | 4.79 |
| Tf ,V (K) | 2126 | 2144 | 2162 | 2181 | 2199 | 2218 | 2237 | 2256 | 2275 |
Table 6: Computed explosion pressures and constant volume adiabatic flame temperatures, Tf, for methane-air mixtures, at T0 = 298 K and p0 = 1 bar(a)
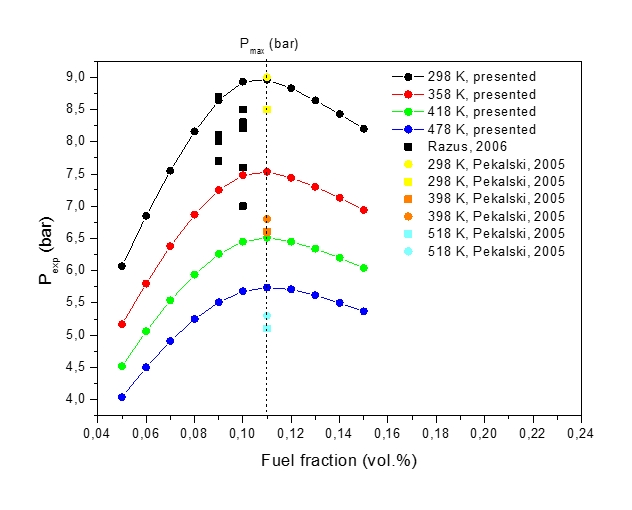
Figure 3: Maximum explosion pressure, pexp, vs volume fraction of methane-air mixture at various initial temperatures, T0 (circle denotes calculation)
Figure 3 shows explosion pressures, pexp, computed for the stoichiometric methane-air mixture at various fuel fractions and various initial temperatures (T298 K, 328 K, 358 K, 388 K, 418 K, 448 K, 478 K, 508 K and 538 K). Increase in the initial temperature lowers the maximum explosion pressure, and increases the flammability range. The shape of the explosion pressure curves with varying methane concentration is similar at all investigated initial temperatures. The maximum value of the explosion pressure is found at 10.5 mole % of methane for all conditions. Calculated explosion pressures show a reasonable agreement with the data in Figure 1-right.
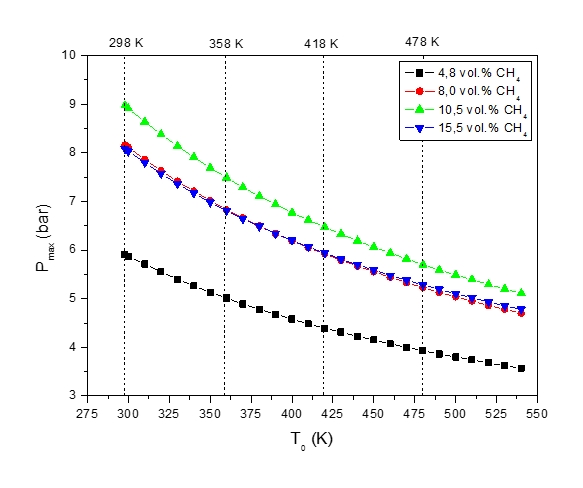
Figure 4: Maximum explosion pressure, pmax, vs temperature, T0, of methane-air mixture at various initial methane vol. fractions
Figure 4 show that the increase in the initial temperature, T0, lowers the explosion pressure, Pexp. When the mixture composition approaches the upper flammability limit the explosion pressure drops sharply to the value almost identical to 8 vol. % in all investigated cases.
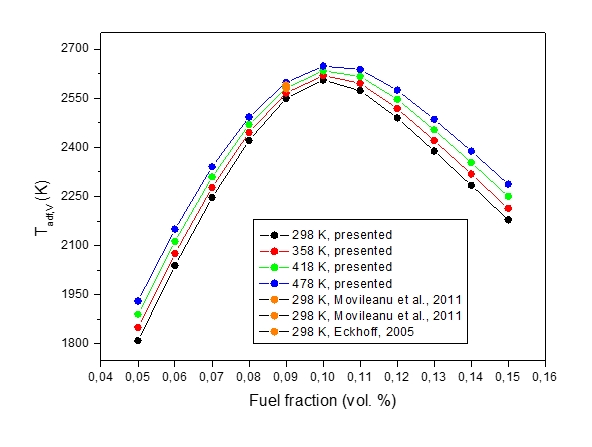
Figure 5: Constant volume adiabatic explosion temperature, Tadf,V, vs volume fraction of fuel / oxidizer at various initial temperatures
Figure 5 shows a set of results for adiabatic flame temperatures, Tadf,V, of isochoric combustion computed for the stoichiometric methane-air mixtures at various initial fuel fractions. The maximum explosion is reached at the methane-air concentration at which the maximum adiabatic flame temperature is attained. It can be stated that the agreement between the calculated values of pmax and corresponding Tf,v is very good (see Table 2).

Figure 6: Volume fraction of explosion products for methane - air mixture (left); Concentration of O2 in products of explosion vs initial temperature of methane - air mixture (right)
Based on the shape of the results in Figure 6-left and curves in Figure 6-right could be stated that the rise in the adiabatic flame temperatures almost do not change the N2, H2O, CO2 and O2 concentration for all investigated fractions of fuel-air mixtures at constant initial pressure. Additionally, calculation was performed of the equilibrium defined post explosion products given in Tables 7-9.
| Compound | Species composition in post-explosion mixture (mole %) at Tinit (K) | ||||||||
|---|---|---|---|---|---|---|---|---|---|
| 298 | 328 | 358 | 388 | 418 | 448 | 478 | 508 | 538 | |
| N2 | 74.03 | 74.12 | 74.11 | 74.09 | 74.08 | 74.07 | 74.06 | 74.04 | 74.03 |
| O2 | 10.26 | 10.25 | 10.24 | 10.23 | 10.21 | 10.20 | 10.19 | 10.17 | 10.16 |
| H2O | 9.55 | 9.58 | 9.58 | 9.58 | 9.57 | 9.57 | 9.56 | 9.56 | 9.55 |
| CO2 | 4.79 | 4.80 | 4.80 | 4.80 | 4.80 | 4.80 | 4.80 | 4.79 | 4.79 |
| NO | 0.42 | 0.27 | 0.28 | 0.30 | 0.33 | 0.35 | 0.37 | 0.39 | 0.42 |
Table 7: Burned gas composition (mole fraction) generated in the isobaric combustion at different Tinit and p0 = 1 bar(a) by the stoichiometric 4.80 vol. % CH4-air mixture.
| Compound | Species composition in post-explosion mixture (mole %) at Tinit (K) | ||||||||
|---|---|---|---|---|---|---|---|---|---|
| 298 | 328 | 358 | 388 | 418 | 448 | 478 | 508 | 538 | |
| N2 | 67.78 | 67.73 | 67.68 | 67.63 | 67.57 | 67.52 | 67.46 | 67.40 | 67.34 |
| H2O | 18.61 | 18.55 | 18.49 | 18.42 | 18.35 | 18.28 | 18.21 | 18.14 | 18.06 |
| CO2 | 6.72 | 6.66 | 6.60 | 6.54 | 6.48 | 6.42 | 6.35 | 6.29 | 6.22 |
| CO | 3.50 | 3.55 | 3.60 | 3.65 | 3.71 | 3.76 | 3.82 | 3.87 | 3.93 |
| H2 | 1.50 | 1.53 | 1.55 | 1.58 | 1.60 | 1.63 | 1.66 | 1.69 | 1.72 |
| O2 | 0.16 | 0.17 | 0.19 | 0.20 | 0.22 | 0.24 | 0.26 | 0.27 | 0.29 |
Table 8: Burned gas composition (mole fraction) generated at different Tinit and p0 = 1 bar(a) by the stoichiometric 10.50 vol. % CH4 - air mixture.
| Compound | Species composition in post-explosion mixture (mole %) at Tinit (K) | ||||||||
|---|---|---|---|---|---|---|---|---|---|
| 298 | 328 | 358 | 388 | 418 | 448 | 478 | 508 | 538 | |
| N2 | 58.18 | 58.18 | 58.18 | 58.17 | 58.17 | 58.16 | 58.16 | 58.15 | 58.15 |
| H2O | 14.98 | 15.00 | 15.01 | 15.03 | 15.04 | 15.06 | 15.07 | 15.08 | 15.10 |
| H2 | 12.36 | 12.34 | 12.31 | 12.29 | 12.27 | 12.24 | 12.22 | 12.20 | 12.17 |
| CO | 11.02 | 11.04 | 11.06 | 11.08 | 11.09 | 11.11 | 11.13 | 11.15 | 11.16 |
| CO2 | 2.66 | 2.64 | 2.62 | 2.60 | 2.58 | 2.57 | 2.55 | 2.53 | 2.51 |
Table 9 Burned gas composition (mole fraction) generated at different Tinit and p0 = 1 bar(a) by the stoichiometric 15.50 vol. % CH4 - air mixture.
In Tables 7-9 only the major products with mole fractions larger than 10-2 are listed. Results of calculations show a reasonable agreement with the data in (Pekalski et al., 2005). The differences in mole fractions of several products between the calculations (see Figure 2 and Table 3) are probably determined by the differences in the initial pressure (5 bar(a)) and between the thermophysical parameters used by the programs, especially the specific heats of examined components in the temperature region with T>300 K. The calculated post explosion composition for CO, CO2 and H2O is close to (Pekalski et al., 2005) calculated compositions, but deviates for H2, NO, H OH and O. Since some species are predicted well and others not, it is therefore difficult to confirm, whether the equilibrium state was attained or not and the fuel could be partly oxidized. Because of the low value of oxygen concentration, the calculated results difference could be attributed to heat losses, due to the long explosion time.
5. Conclusion
Adiabatic flame temperatures, adiabatic explosion pressures and post combustion products composition of methane-air mixtures at various initial temperatures were calculated. The influences of initial temperature are compared with the experimental results and with the equilibrium calculations. Although the results from the evaluation indicate that presented theoretical simulations can become a valuable tool for rough estimation, the modeling requires further improvements to be useful for consequence modeling and design of industrial facilities. Thus, at the first stage, the equilibrium calculations can be used as a rough calculation of a worst case scenario. At the same time, these values will be used as approximate initial values for explosion experiments carried out in heated 1 m3 explosion apparatus built by OZM Research s.r.o. at Energy Research Centre, VŠB - Technical University of Ostrava.
6. Acknowledgement
This work would not have been possible without the financial support of two grants: (1) Innovation for Efficiency and Environment, reg. no. ED0036/01/01 supported by Operation Program Research and development for Innovation and financed by the Ministry of Education, Youth and Sports; (2) Innovation for Efficiency and Environment - Growth, reg. no. LO1403 supported by National Programme for Sustainability and financed by the Ministry of Education, Youth and Sports. J.V. is thankful for the financial support of the project “Support research and development in the Moravian-Silesian Region 2014 DT 1-International research teams” 02722/2014/RRC, financed from the budget of the Moravian-Silesian Region. J.S. is thankful to his advisors Ing. Jan Koloničný, Ph.D. and doc. Dr. Ing. Břetislav Janovský, CSc. for their knowledge support in the area of decision process, industrial explosion experiments and enthusiasm for a team work.
7. References
[1] MOVILEANU, C.; MITU, M.; BRINZEA, V. …[et al.]. Adiabatic Flame Temperature of Fuel-Air Mixtures in Isobaric and Isochoric Combustion Processes. Rev. Chim., 2011, vol. 62, No. 4, pp. 376-379.
[2] Guidelines for Safe Storage and Handling of Reactive Materials. CCPS (Center for Chemical Process Safety), 1995. 364 s. ISBN 978-0-8169-0629-1.
[3] EN 13673-1. Determination of maximum explosion pressure and maximum explosion pressure rise - Part I: maximum explosion pressure. 2003.
[4] RAZUS, D.; OANCEA, D.; MOVILEANU, C. Burning velocity evaluation from pressure evolution during the early stage of closed-vessel explosion. Journal of Loss Prevention in the Process Industries, 2006, vol. 19, n. 4, pp. 334-342.
[5] CASHDOLLAR, K. L. …[et al.] Flammability of methane, propane, and hydrogen gases. Journal of Loss Prevention in the Process Industries, 2000, vol. 13, no. 3-5, pp. 327–340.
[6] ECKHOFF, R. Explosion Hazards in the Process Industries. 1st ed. Gulf Publishing Company, 2005. 436 s. ISBN 978-0-9765-1134-2.
[7] PEKALSKI A. A. …[et al.]. Determination of the Explosion Behaviour of Methane and Propene in Air or Oxygen at Standard and Elevated Conditions. Process Safety and Environmental protection, 2005, vol. 83, no. B5, pp. 421-429.
[8] MOORE, W. J. Physical Chemistry. 4th.ed. Longmans Green & Co, 1963.
[9] REYNOLDS, W.C. The element potential method for chemical equilibrium analysis: implementation in the interactive program STANJAN : version 3 : 1986. Department of mechanical engineering Stanford University, 1986.
Vzorová citace
SKŘÍNSKÝ, Jan …[et al.]. Explosion chracteristics of methane at elevated initial temperatures. Časopis výzkumu a aplikací v profesionální bezpečnosti [online], 2015, roč. 8, č. 2-3. Dostupný z WWW: <http://www.bozpinfo.cz/josra/josra-02-03-2015/methane-explosion-characterist.html>. ISSN 1803-3687.
Užitečné odkazy
Provozovatel portálu
Jeruzalémská 1283/9
110 00 Praha 1
Sociální sítě VÚBP
![]()
![]()
![]()
![]()
![]()
![]()
![]()
Kde nás najdete
